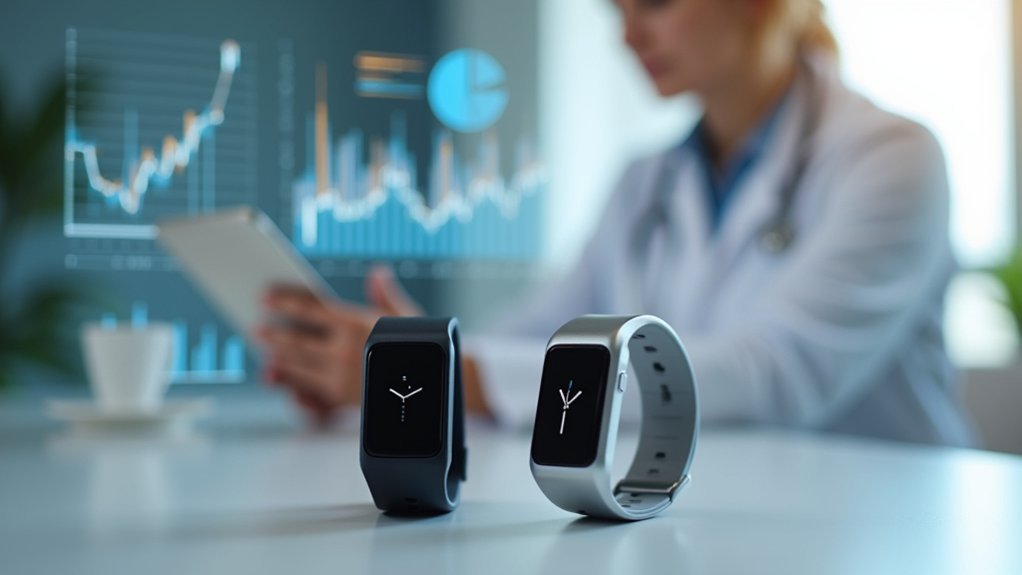
When evaluating wrist tracker accuracy studies, you’ll need to examine participant diversity across age, BMI, and fitness levels, ensuring sample sizes of at least 45 subjects for robust analysis. Look for studies using gold standard comparisons like ECG monitors and polysomnography, with Bland-Altman analysis and Kappa statistics above 0.75. Check if researchers controlled environmental factors and tested across various activity intensities. Pay attention to demographic variables like skin tone affecting heart rate accuracy and real-world performance limitations that impact clinical applications.
Study Design and Participant Selection Criteria

When designing studies to evaluate wrist tracker accuracy, you’ll need to carefully select participants who represent the diverse population that will ultimately use these devices.
Your study design should include a balanced mix of age, sex, body mass index, and fitness levels to enhance generalizability. You’ll want at least 20 to 60 participants for robust statistical analysis and reliable error estimation.
Create a standardized exercise protocol in controlled settings, allowing accurate comparison against gold standard measurements like ECG or indirect calorimetry.
Don’t overlook collecting detailed demographic data, including skin tone and wrist characteristics, as these factors greatly influence wrist-worn devices’ measurement accuracy.
Your participant selection criteria should specify health status requirements for relevant real-world assessment scenarios.
Sample Size and Statistical Power Considerations
Determining adequate sample size represents one of the most critical decisions you’ll make in your wrist tracker accuracy study, as insufficient power can render even well-designed research meaningless. You’ll need at least 45 participants for moderate effect sizes in accuracy assessments, though 30 subjects per group works for basic comparisons.
| Sample Size | Statistical Methods Available |
|---|---|
| 30-44 participants | Basic correlation analysis |
| 45-60 participants | Robust ICC calculations |
| 60+ participants | Extensive Bland-Altman analysis |
| 100+ participants | Subgroup demographic analysis |
Your participant demographic diversity enhances statistical power considerably. Include varied ages, BMI levels, and fitness backgrounds to strengthen your wearable technology evaluation. Larger samples enable sophisticated statistical methods like intraclass correlation coefficients and facilitate identifying correlations between clinical variables and tracker performance.
Gold Standard Comparison Methods
Although your study design may be robust, its validity ultimately depends on selecting appropriate gold standard devices that serve as the definitive benchmark for accuracy assessment.
You’ll need clinically validated equipment like ECG monitors for heart rate (HR) and indirect calorimetry for energy expenditure (EE) measurements.
To evaluate wrist tracker accuracy effectively, implement these comparison methods:
- Calculate percent error using the formula: (device measurement – gold standard)/gold standard
- Apply Bland-Altman analysis to visualize agreement and identify systematic biases
- Use mixed effects linear regression models to account for activity type and intensity variables
- Employ two-way ANOVA to assess demographic factors’ impact on accuracy
- Confirm your gold standard devices maintain consistent calibration throughout testing
These methods provide thorough accuracy evaluation frameworks for your research.
Device Testing Protocols and Conditions
When you’re evaluating wrist tracker accuracy, you’ll need to establish standardized testing environments that eliminate variables that could skew your results.
Your testing protocol should include controlled laboratory settings where temperature, humidity, and lighting remain consistent throughout all measurement sessions.
You’ll also want to select activities that span the full range of intensities your target users will encounter, from gentle walking to high-intensity interval training.
Standardized Testing Environments
Since external variables can greatly skew accuracy measurements, establishing standardized testing environments becomes crucial for reliable wrist tracker evaluation.
You’ll need controlled laboratory settings that minimize interference and guarantee consistent conditions across all tests of wrist-worn activity trackers.
Your standardized testing environments should include:
- Controlled temperature and humidity to prevent environmental factors from affecting device sensors
- Consistent lighting conditions that won’t interfere with optical heart rate (HR) sensors
- Standardized equipment setup following manufacturers instructions for proper device positioning
- Uniform data collection protocols that guarantee synchronized timing across all measurement devices
- Diverse participant demographics including varied ages, weights, and wrist circumferences for thorough evaluation
This controlled approach allows you to isolate device performance variables and obtain reliable, reproducible results.
Activity Selection Criteria
With your controlled testing environment established, you must carefully select activities that challenge wrist trackers across realistic usage scenarios. Your activity selection should include dynamic movements representing daily living—walking, running, and cycling—to assess accuracy of wearable devices across varying intensities.
Implement a standardized exercise protocol beginning with seated baseline measurements, then gradually increase intensity to simulate real-world conditions.
When planning data collection, guarantee your participant demographics maximize diversity in age, fitness levels, and physiological characteristics. This approach helps you understand how individual factors influence device performance across different populations.
Focus on activities that stress different measurement capabilities of wrist trackers, from low-intensity movements to high-impact exercises, providing thorough evaluation data for meaningful accuracy assessments.
Sleep Stage Detection Accuracy Metrics

Although wrist trackers have become increasingly sophisticated in monitoring sleep patterns, their accuracy in detecting specific sleep stages requires careful evaluation through established metrics.
While wrist trackers offer advanced sleep monitoring capabilities, their sleep stage detection accuracy demands rigorous assessment using validated scientific metrics.
You’ll need to assess wearable device features and their impact on sleep stage detection performance using standardized measurements.
Key accuracy metrics you should examine include:
- Sensitivity and specificity – measuring the tracker’s ability to correctly identify and exclude specific sleep stages
- Kappa statistics – values above 0.75 indicate excellent agreement with polysomnography
- Mean absolute percentage error – quantifying average percentage deviation from gold standard results
- Overall classification accuracy – comparing tracker data against PSG measurements
- Stage-specific performance – deep sleep typically shows higher accuracy than light sleep or REM detection
These accuracy metrics help you determine which trackers provide reliable sleep stage information.
Total Sleep Time Measurement Validation
Beyond evaluating how well trackers identify individual sleep stages, you must validate their ability to measure total sleep time accurately.
Validation studies compare wrist tracker outputs against polysomnography, the gold standard for sleep assessment. You’ll find that accuracy varies considerably across devices, with mean absolute percentage error typically ranging from 15% to 30%.
When examining correlation coefficients between tracker estimates and polysomnography results, you should expect values between 0.60 and 0.85, indicating moderate to good agreement.
However, you need to reflect on several limitations affecting accuracy, including movement interference during sleep and algorithmic differences in sleep detection.
Confirm validation studies include diverse participant samples to assess how factors like age, gender, and sleep disorders impact measurement precision.
Sleep Efficiency and Wake Time Analysis
When you’re analyzing sleep efficiency and wake time data from your wrist tracker, you’ll encounter three critical measurement areas that determine overall accuracy.
Your device’s ability to detect different sleep stages directly impacts how it calculates the percentage of time you’re actually asleep versus lying awake in bed.
The frequency of wake episodes your tracker records throughout the night, combined with its assessment of total sleep duration, creates the foundation for understanding whether you’re getting quality, uninterrupted rest.
Sleep Stage Detection
Sleep trackers must accurately distinguish between different sleep stages to provide meaningful insights about your rest quality, yet this remains one of their most challenging functions.
Consumer-grade sleep trackers show considerable limitations when compared to polysomnography, the gold standard for sleep measurement.
Here’s what affects sleep stage detection accuracy:
• Mean absolute percentage error ranges from 10% to 30% for sleep duration estimates
- Wrist movement during restless periods leads to higher wake time classification errors
- Moderate agreement with clinical standards, achieving 70% to 80% sensitivity and specificity
- Light sleep periods are frequently misclassified as wake time
- Device placement considerably impacts detection reliability
- Underestimation bias – Devices typically underestimate sleep by 15-20% compared to polysomnography
- Movement during sleep – Restless sleepers experience misclassification of wake periods as sleep
- Device placement variations – Wrist position greatly impacts measurement consistency
- Sleep efficiency calculations – Ratios between actual sleep and time in bed show considerable variability
- User-specific factors – Individual characteristics create inconsistent data interpretation across different people
- REM sleep detection achieves approximately 80% sensitivity in consumer-grade devices
- Light sleep accuracy drops noticeably to only 50-60% in most studies
- Deep sleep and wakefulness show the highest detection rates among all stages
- Sleep stage changes present the greatest challenge for accurate classification
- Individual factors like BMI can increase detection errors substantially
- Step counting errors ranging from 23.5% to 65.5% during varied daily activities
- Heart rate measurements showing less than 5% error during steady activities but exceeding 20% during dynamic movements
- Energy expenditure estimations with errors between 27.4% and 92.6%, particularly during sedentary tasks
- Tracking variability influenced by wrist movement, activity type, and exercise intensity
- Limited ecological validity when translating controlled study results to unmonitored environments
Understanding these limitations helps you interpret your tracker’s data more critically and avoid making health decisions based solely on potentially inaccurate sleep stage information.
Wake Episode Frequency
Although tracking sleep stages presents considerable challenges, wake episode frequency analysis reveals even more concerning accuracy gaps in consumer wrist trackers. When you’re evaluating these devices, you’ll find they consistently underestimate wake time and overestimate sleep duration compared to polysomnography gold standards.
This directly impacts sleep efficiency calculations, as frequent wake episodes that trackers miss can considerably skew your data collection results.
You should focus on how wrist-worn trackers capture nighttime awakenings, since these episodes critically affect sleep architecture and restorative phases. The algorithms used in consumer devices often lack sensitivity to detect brief awakenings, leading to inflated sleep efficiency scores.
For accurate assessment, you’ll need to compare tracker-reported wake episode frequency against polysomnography data to identify systematic measurement errors.
Total Sleep Duration
Beyond wake episode detection, total sleep duration measurements expose fundamental limitations in how wrist trackers calculate sleep efficiency and analyze wake time patterns.
When you’re examining these devices, you’ll discover that accuracy varies dramatically based on device type and individual user characteristics.
Key factors affecting total sleep duration accuracy include:
These limitations mean you can’t rely solely on absolute duration numbers when evaluating tracker performance.
Environmental and Demographic Variables Impact
When evaluating wrist tracker accuracy, you’ll find that environmental conditions and your personal characteristics greatly influence device performance.
Environmental factors like lighting conditions and walking surfaces considerably affect step counting accuracy – you’ll notice different readings when walking on grass versus pavement.
Demographic variables play equally important roles in measurement precision. Your body mass index affects sensor sensitivity, while skin tone impacts heart rate accuracy due to sensor limitations that may provide less reliable readings for darker skin tones.
Age and fitness level introduce additional variability, as different gait patterns challenge tracker interpretation.
Individual differences in walking speed and step length correlate with measurement errors, suggesting you’ll need personalized assessments for peak accuracy.
Error Rate Patterns Across Sleep Phases
You’ll find that wrist trackers don’t perform equally well across all sleep phases, with accuracy dropping considerably during deep sleep compared to lighter stages.
Your device’s sleep stage detection capabilities become particularly challenged when distinguishing between different phases, often misclassifying shifts and shorter sleep cycles.
REM tracking presents the greatest limitation, as these devices frequently struggle to accurately identify and measure REM periods due to the complex physiological patterns that occur during this critical sleep stage.
Sleep Stage Detection Accuracy
Although wrist trackers excel at measuring basic sleep metrics like duration, their ability to accurately distinguish between different sleep stages reveals considerable limitations.
When you’re evaluating wearable devices for sleep stage detection, you’ll find that accuracy varies dramatically depending on which phase you’re examining.
Here’s what research shows about detection reliability:
Compared to polysomnography, the gold standard, wrist trackers consistently underestimate total sleep time while overestimating periods of wakefulness, creating unreliable stage classifications.
REM Tracking Limitations
REM sleep tracking presents particularly complex challenges that extend beyond the general stage detection problems already discussed.
You’ll find that wrist trackers struggle most during REM phases, where error rates can spike up to 30% compared to other sleep stages. This occurs because REM sleep involves subtle muscle movements that your device’s sensors can misinterpret.
Wrist movement during REM creates significant interference with accuracy, as does inconsistent skin contact throughout the night. Poor device calibration compounds these issues, leading to systematic underestimation of REM duration.
When evaluating studies, you should pay attention to how researchers address these limitations. Many devices compensate by reporting sleep quality metrics that downplay REM tracking weaknesses, potentially masking the true scope of measurement errors.
Real-World Performance Versus Laboratory Settings
When researchers test wrist trackers in controlled laboratory environments, the results don’t always match what you’ll experience during everyday use.
This gap between laboratory and real world performance markedly impacts how you should interpret accuracy assessments for wrist-worn activity trackers.
Key performance differences you’ll encounter include:
Clinical Relevance and Practical Applications
Since healthcare providers increasingly rely on wrist trackers for patient monitoring, understanding their clinical limitations becomes essential for making informed treatment decisions.
When you’re implementing wrist-worn devices in clinical settings, you’ll encounter significant accuracy challenges that directly impact postoperative care. The 23.5% to 65.5% undercounting of step counts in post-surgical patients means you can’t rely on these readings for critical rehabilitation decisions.
You’ll need proper validation protocols before integrating these devices into patient care workflows. While HR accuracy may improve as patients recover and increase mobility, the initial postoperative period shows concerning measurement errors.
Consider these limitations when designing early mobilization protocols, as inaccurate data could lead to inappropriate clinical interventions and compromised patient outcomes.
Frequently Asked Questions
Are Wrist Trackers Accurate?
Wrist trackers aren’t accurate for you after major abdominal surgery. They’ll undercount your steps by 23-66%, especially if you’re walking slowly or have drains, making them unreliable for tracking recovery.
How Accurate Are Fitness Trackers Study?
You’ll find fitness trackers undercount steps by 23-66% post-surgery, with accuracy errors ranging from 25-66%. They’re particularly unreliable during early recovery when you’re walking slower with shorter steps.
What Is the Most Accurate Wrist Calorie Tracker?
You’ll find the Apple Watch is currently the most accurate wrist calorie tracker, with just 2.0% heart rate error. However, you should still use specific activity modes for better calorie estimates.
How to Make a Fitness Tracker More Accurate?
You can improve your fitness tracker’s accuracy by updating firmware regularly, calibrating stride length personally, wearing it snugly, and choosing devices with multiple sensors like accelerometers and gyroscopes.


Leave a Reply